October 03: Behaviour of Gases
Assignments due: How Big is One Mole of Gas?
During class, we explored the behaviour of gases when the temperature and pressure were changed. We did this through Experiment A and Experiment B. The relationship between the volume of gas and the temperature/pressure was recorded in Logger Pro and could be analysed using the graphs.
Experiment A (Pressure vs Volume):
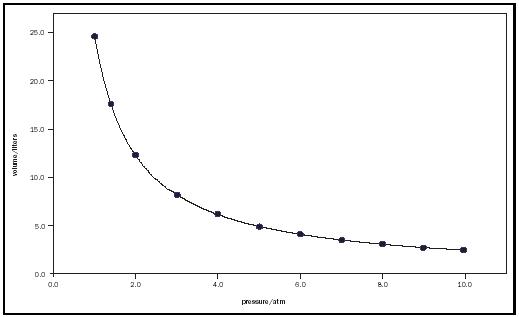
In experiment A, we explored the relationship between pressure and volume. We did so by changing the volume of a gas and recording its pressure. The relationship found was that pressure is inversely proportional to volume.
We learnt about this in Boyle's Law. We can state Boyle's Law as the following:

We found this relationship by measuring the volume and pressure of a gas in a syringe when the volume is changed. The Logger Pro data we found looked like this:

However, if we changed the values of volume to be a reciprocal on Logger Pro, we were able to analyse a linear graph and prove Boyle's Law. The processed graph would look like this:

Experiment B (Pressure vs Temperature):
Our second experiment was to find the relationship between temperature and pressure. We did so by changing the temperature of a gas and recording its pressure. The relationship found was that pressure is proportional to temperature.
This relationship is described in Gay-Lussac's Law which can be expressed as:

The relationship was found by heating water and placing a flask of gas in different temperatures. The pressures recorded in the Logger Pro was expressed in a linear graph and proved Gay-Lussac's Law. The Logger Pro graph looked like this:

No comments:
Post a Comment